
Investor Presentation NASDAQ: QMCO February 2021 Exhibit 99.2
Safe Harbor Statement Safe Harbor Statement. This presentation contains forward-looking statements including, without limitation, statements about the Company’s plans, strategies, priorities and prospects including the Company’s transformation initiatives, capital structure and go to market strategies; the Company’s future operating results and financial position; the Company’s market growth; and the Company’s objectives for future operations. These statements may include words such as “believe,” “may,” “will,” “estimate,” “continue,” “anticipate,” “intend,” “expect,” “could,” “would,” “project,” “plan,” “potentially,” “preliminary,” “likely,” and similar expressions and are intended to identify forward-looking statements. These forward-looking statements are based on information available to the Company as of the date of this presentation and are based on management’s current views and assumptions. These forward-looking statements are conditioned upon and also involve a number of known and unknown risks, uncertainties, and other factors beyond the Company’s control that could cause actual results, performance or events to differ materially from those anticipated by these forward-looking statements. Such risks and uncertainties may include, but are not limited to changes in market demands and the effects of the competitive markets in which the Company competes; changes in technology; market acceptance of new products; the Company’s ability to implement its strategies and plans; the Company’s ability to successfully qualify and sell its products and services in increasing volumes on a cost-effective basis; the Company’s ability to generate sufficient cash flows from operations to meet its liquidity requirements; the continued impact of the COVID-19 pandemic on the Company’s business and the evolving legal, regulatory, and administrative climate in the international markets where the Company operates. Information concerning risks, uncertainties and other factors that could cause results to differ materially from the expectations described in this presentation is contained in the “Risk Factors” sections in the Company’s Annual Report on Form 10-K and the Quarterly Report on Form 10-Q, filed on June 24, 2020, October 28, 2020 and January 27, 2021, respectively, with the U.S. Securities and Exchange Commission (“SEC”), and other documents filed with or furnished to the SEC. These forward-looking statements should not be relied upon as representing the Company’s views as of any subsequent date. The Company does not intend to update forward-looking statements to reflect events or circumstances after the date they were made, unless required by law or regulation. A registration statement on Form S-3 has been filed with the Securities and Exchange Commission and declared effective. The offering of these securities will be made only by means of a written prospectus supplement and base prospectus forming part of the effective registration statement relating to the shares. Copies of the prospectus for this offering may be obtained, when available, by contacting B. Riley Securities, Inc., Attention: Prospectus Department, 1300 North 17th Street, Suite 1300, Arlington, Virginia 22209, or by telephone at 703-312-9580 or by email at prospectuses@brileyfin.com or Oppenheimer & Co. Inc., Attention: Syndicate Prospectus Department, 85 Broad Street, 26th Floor, New York, New York 10004, by telephone at 212-667-8055, or by email at EquityProspectus@opco.com. Use of Non-GAAP Financial Information. In this presentation, the Company will be discussing non-GAAP measures of non-GAAP gross margin, non-GAAP operating expenses, adjusted EBITDA, adjusted EBITDA margin, non-GAAP net income and non-GAAP net income per share, which are adjusted from results based on GAAP. These non-GAAP financial measures are provided to enhance the user's overall understanding of the Company’s current financial performance and the Company’s prospects for the future and are not comprehensive of the Company’s financial results. Such measures should not be viewed as a substitute for the Company’s financial statements prepared in accordance with GAAP. We have provided in the attached appendix a reconciliation of these metrics to the most directly comparable GAAP financial measures. We have presented Adjusted EBITDA because it is a key measure used by our management and the board of directors to understand and evaluate our core operating performance and trends, to prepare and approve our annual budget and to develop short and long-term operating plans. In particular, we believe that the exclusion of the amounts eliminated in calculating Adjusted EBITDA can provide a useful measure for period-to-period comparisons of our core business performance. We believe non-GAAP gross margin, non-GAAP operating expenses, non-GAAP net income and non-GAAP net income per share serve as appropriate measures to be used in evaluating the performance of our business and help our investors better compare our operating performance over multiple periods. Accordingly, we believe that these metrics provide useful information to investors and others in understanding and evaluating our operating results in the same manner as our management and our board of directors.
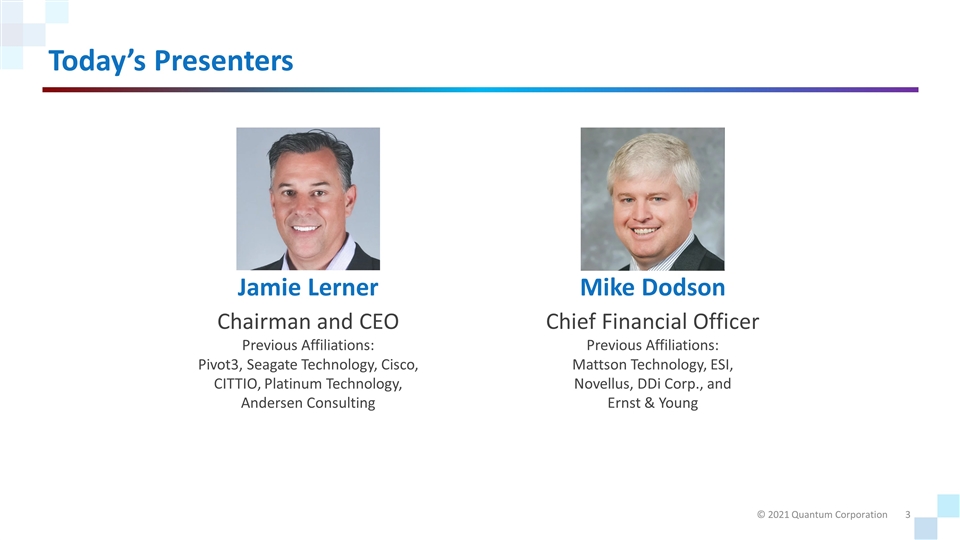
Today’s Presenters Jamie Lerner Chairman and CEO Previous Affiliations: Pivot3, Seagate Technology, Cisco, CITTIO, Platinum Technology, Andersen Consulting Mike Dodson Chief Financial Officer Previous Affiliations: Mattson Technology, ESI, Novellus, DDi Corp., and Ernst & Young
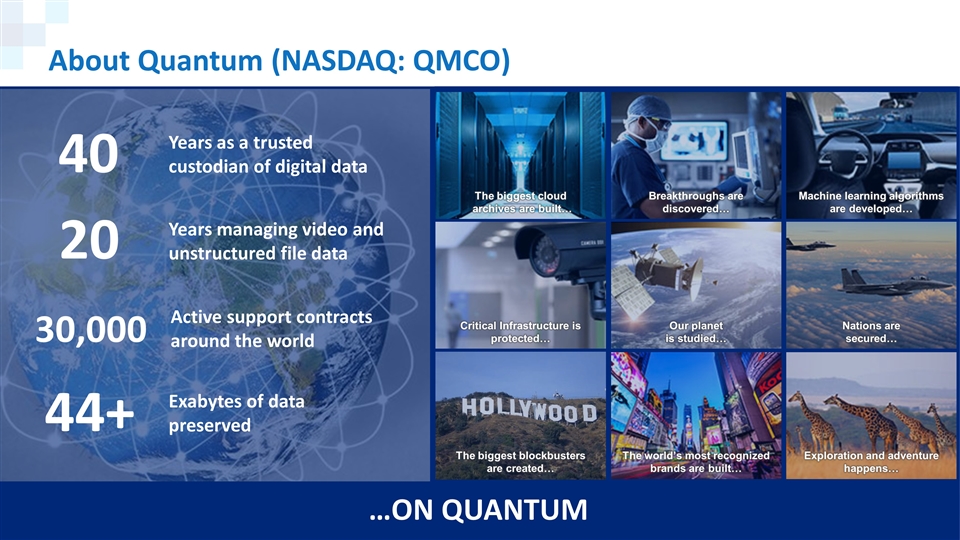
About Quantum (NASDAQ: QMCO) …ON QUANTUM The biggest blockbusters are created… The world’s most recognized brands are built… Exploration and adventure happens… Critical Infrastructure is protected… Our planet is studied… Nations are secured… Machine learning algorithms are developed… Breakthroughs are discovered… The biggest cloud archives are built… Years as a trusted custodian of digital data Years managing video and unstructured file data Active support contracts around the world Exabytes of data preserved 20 30,000 44+ 40

By 2025 80% of Data is Unstructured; Video and Digital Images Source: IDC Datasphere reports
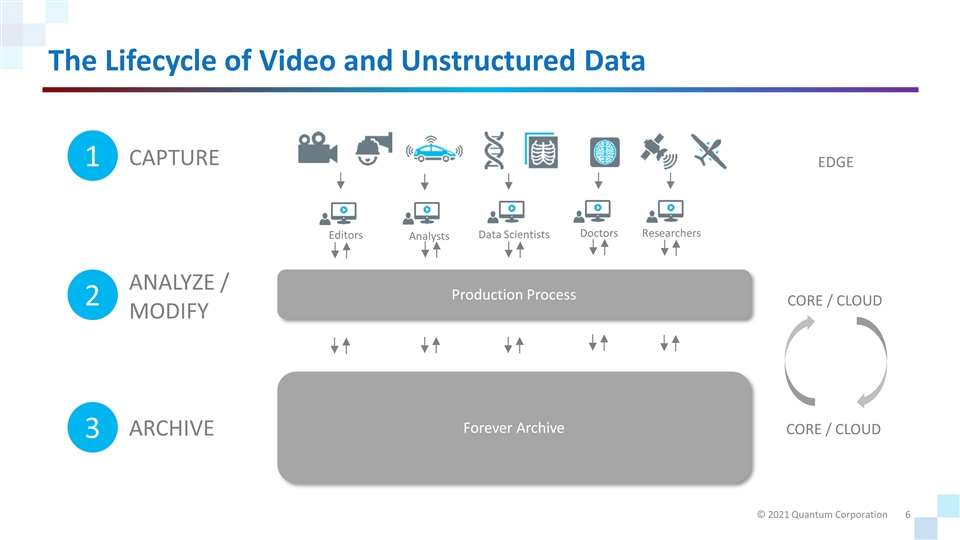
The Lifecycle of Video and Unstructured Data CAPTURE 1 EDGE ANALYZE / MODIFY 2 ARCHIVE 3 CORE / CLOUD CORE / CLOUD Editors Analysts Data Scientists Doctors Researchers Production Process Forever archive Forever Archive
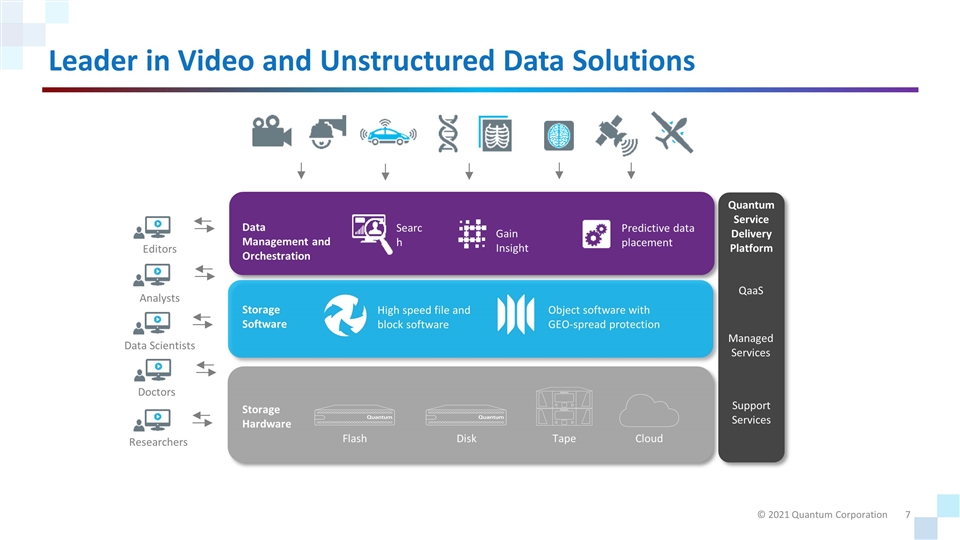
Leader in Video and Unstructured Data Solutions Flash Disk Cloud Storage Hardware High speed file and block software Storage Software Object software with GEO-spread protection Gain Insight Data Management and Orchestration Predictive data placement Search Quantum Service Delivery Platform QaaS Managed Services Editors Analysts Data Scientists Doctors Researchers Support Services Tape
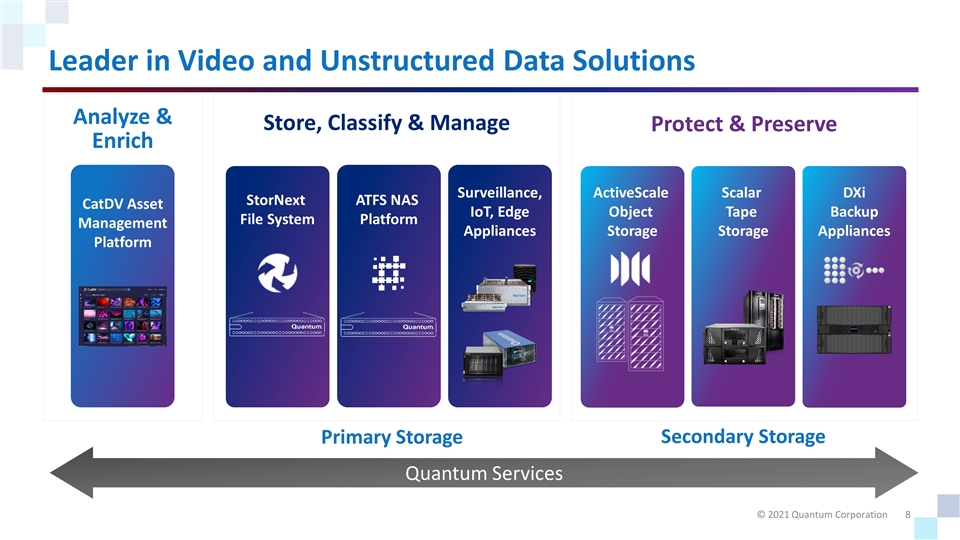
Leader in Video and Unstructured Data Solutions Quantum Services Analyze & Enrich Protect & Preserve CatDV Asset Management Platform StorNext File System ATFS NAS Platform ActiveScale Object Storage Scalar Tape Storage DXi Backup Appliances Store, Classify & Manage Surveillance, IoT, Edge Appliances Primary Storage Secondary Storage
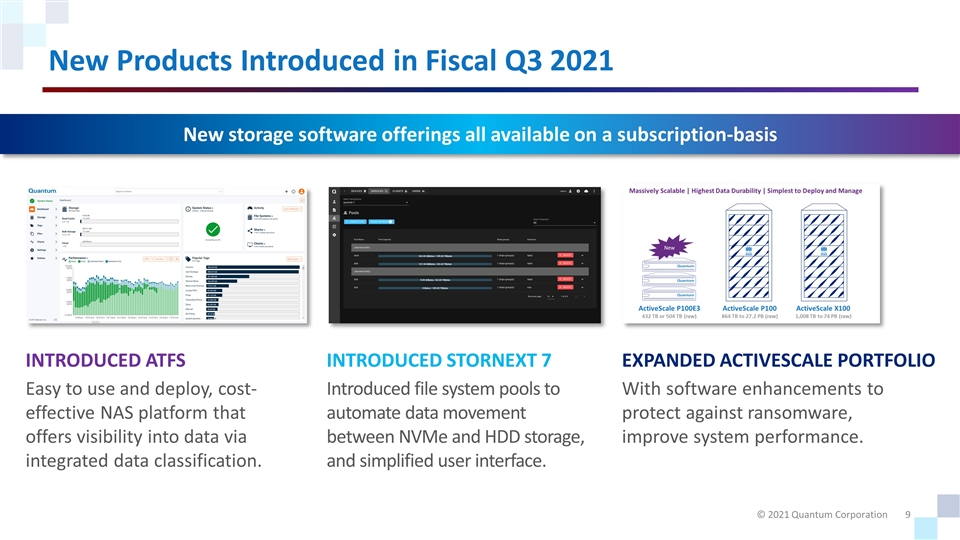
New Products Introduced in Fiscal Q3 2021 INTRODUCED ATFS Easy to use and deploy, cost-effective NAS platform that offers visibility into data via integrated data classification. INTRODUCED STORNEXT 7 Introduced file system pools to automate data movement between NVMe and HDD storage, and simplified user interface. EXPANDED ACTIVESCALE PORTFOLIO With software enhancements to protect against ransomware, improve system performance. New storage software offerings all available on a subscription-basis
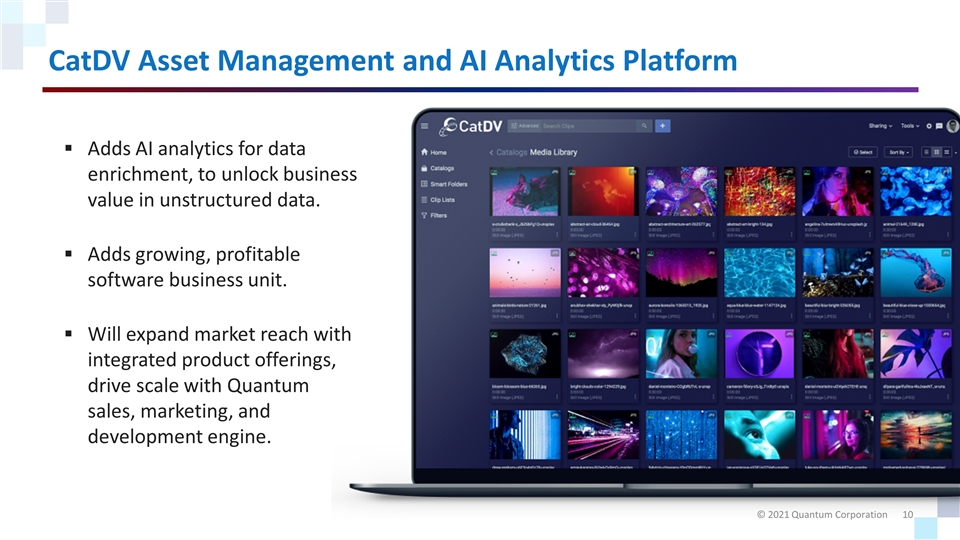
CatDV Asset Management and AI Analytics Platform Adds AI analytics for data enrichment, to unlock business value in unstructured data. Adds growing, profitable software business unit. Will expand market reach with integrated product offerings, drive scale with Quantum sales, marketing, and development engine.
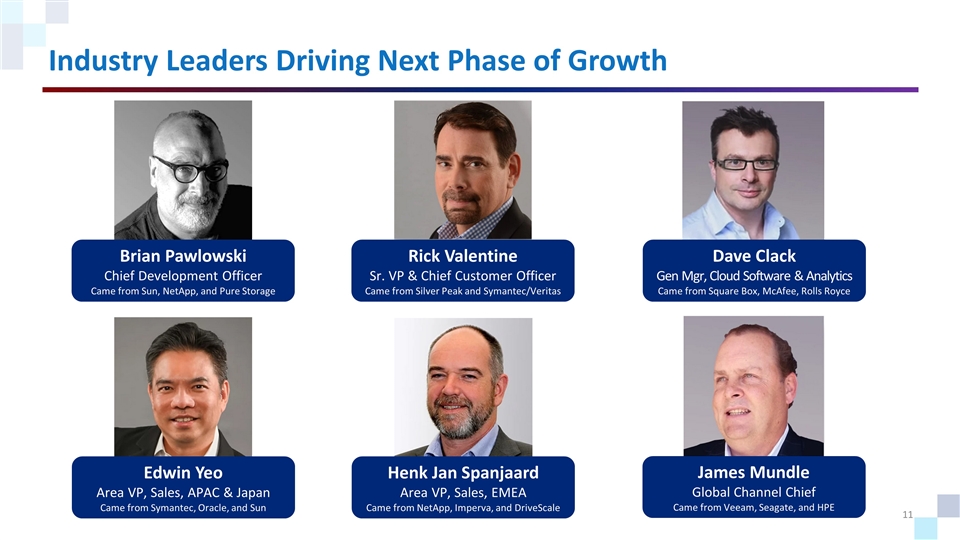
Industry Leaders Driving Next Phase of Growth Brian Pawlowski Chief Development Officer Came from Sun, NetApp, and Pure Storage Rick Valentine Sr. VP & Chief Customer Officer Came from Silver Peak and Symantec/Veritas Henk Jan Spanjaard Area VP, Sales, EMEA Came from NetApp, Imperva, and DriveScale Edwin Yeo Area VP, Sales, APAC & Japan Came from Symantec, Oracle, and Sun James Mundle Global Channel Chief Came from Veeam, Seagate, and HPE Dave Clack Gen Mgr, Cloud Software & Analytics Came from Square Box, McAfee, Rolls Royce
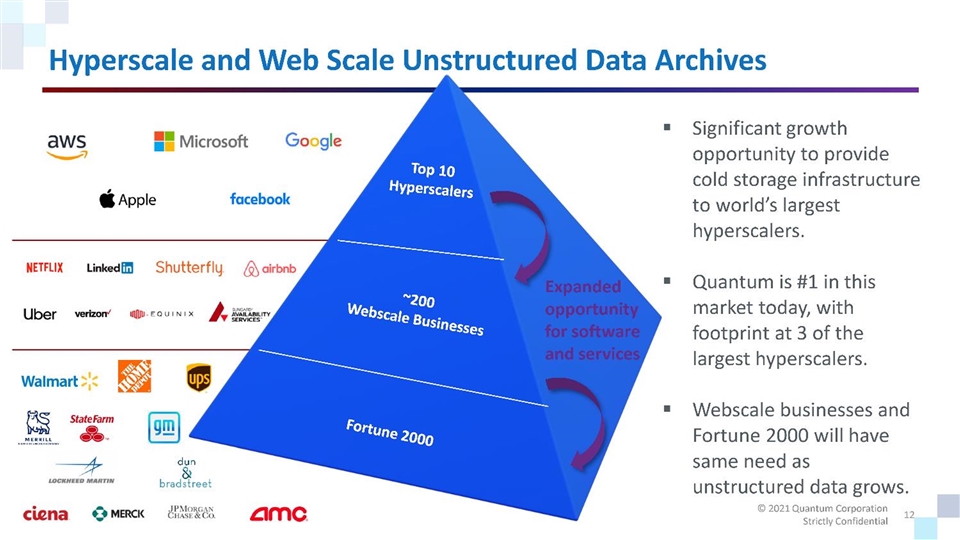
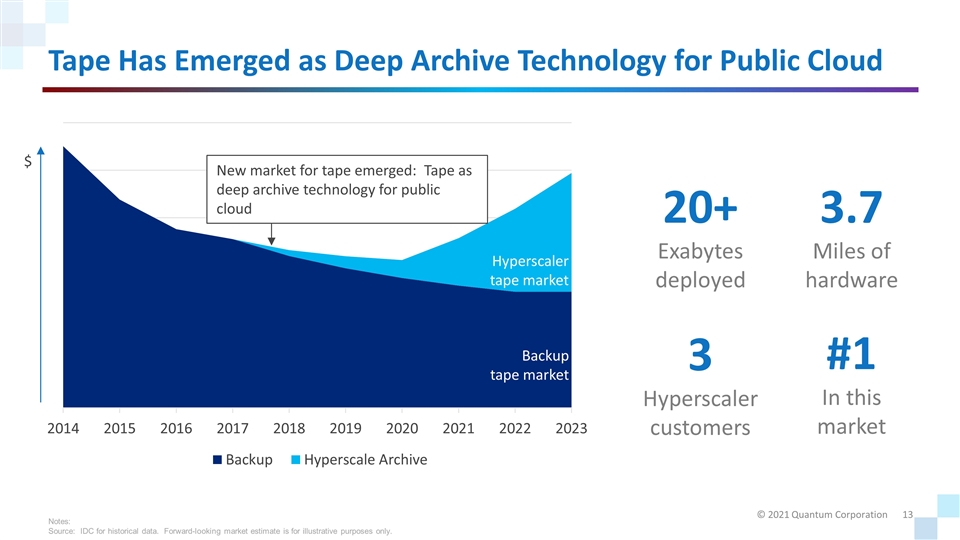
Tape Has Emerged as Deep Archive Technology for Public Cloud 20+ Exabytes deployed 3.7 Miles of hardware 3 Hyperscaler customers #1 In this market Backup tape market $ Hyperscaler tape market New market for tape emerged: Tape as deep archive technology for public cloud Notes: Source: IDC for historical data. Forward-looking market estimate is for illustrative purposes only.
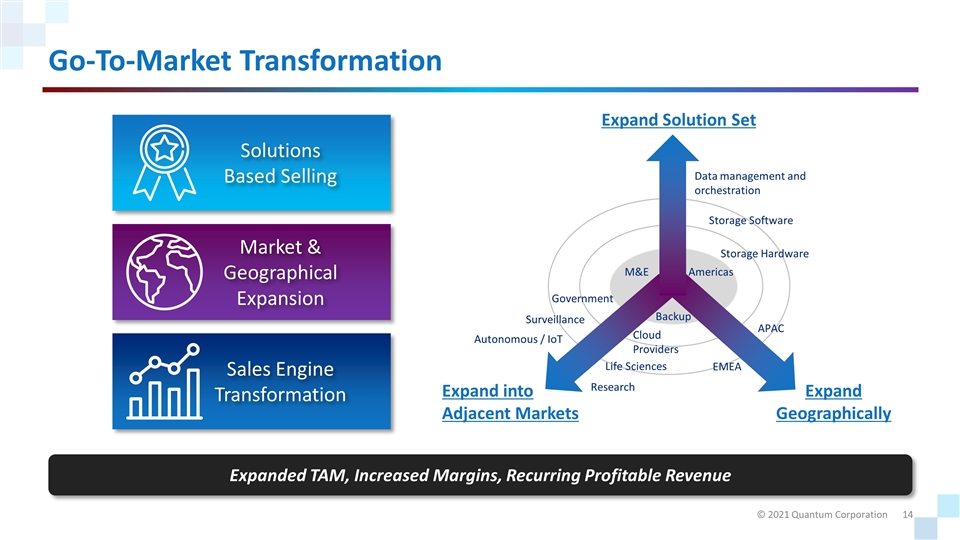
Go-To-Market Transformation Storage Software Storage Hardware Data management and orchestration Americas EMEA APAC M&E Surveillance Autonomous / IoT Government Life Sciences Research Cloud Providers Backup Expand Solution Set Expand Geographically Expand into Adjacent Markets Market & Geographical Expansion Sales Engine Transformation Solutions Based Selling Expanded TAM, Increased Margins, Recurring Profitable Revenue
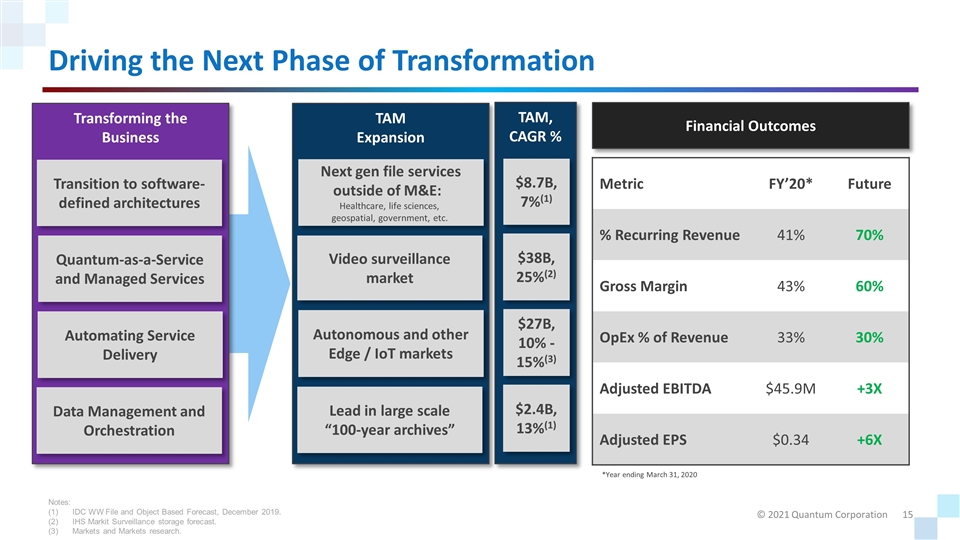
Driving the Next Phase of Transformation Financial Outcomes Metric FY’20* Future % Recurring Revenue 41% 70% Gross Margin 43% 60% OpEx % of Revenue 33% 30% Adjusted EBITDA $45.9M +3X Adjusted EPS $0.34 +6X *Year ending March 31, 2020 TAM Expansion Next gen file services outside of M&E: Healthcare, life sciences, geospatial, government, etc. Lead in large scale “100-year archives” Video surveillance market TAM, CAGR % $38B, 25%(2) $8.7B, 7%(1) $2.4B, 13%(1) Autonomous and other Edge / IoT markets $27B, 10% -15%(3) Transforming the Business Transition to software-defined architectures Automating Service Delivery Quantum-as-a-Service and Managed Services Data Management and Orchestration Notes: IDC WW File and Object Based Forecast, December 2019. IHS Markit Surveillance storage forecast. Markets and Markets research.
NASDAQ: QMCO Financials
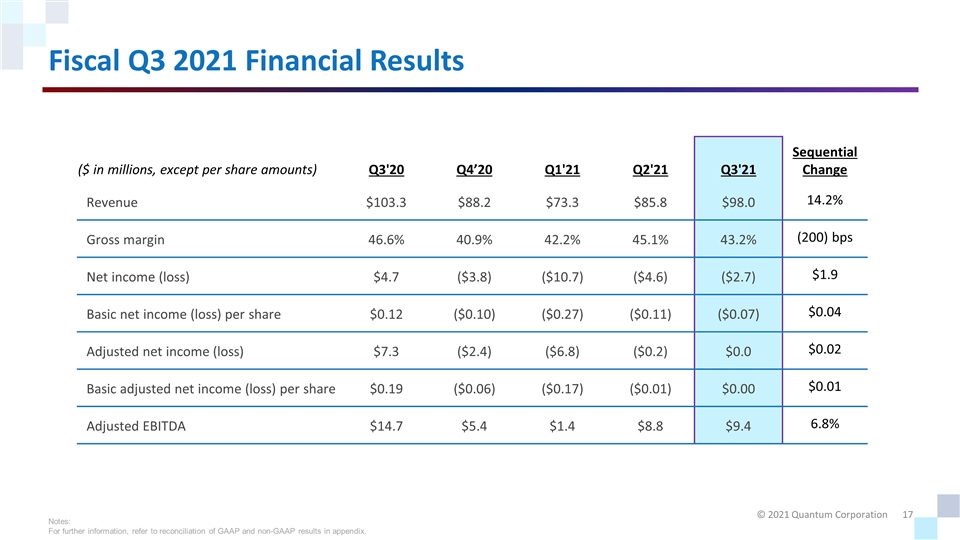
Fiscal Q3 2021 Financial Results ($ in millions, except per share amounts) Q3'20 Q4’20 Q1'21 Q2'21 Q3'21 Sequential Change Revenue $103.3 $88.2 $73.3 $85.8 $98.0 14.2% Gross margin 46.6% 40.9% 42.2% 45.1% 43.2% (200) bps Net income (loss) $4.7 ($3.8) ($10.7) ($4.6) ($2.7) $1.9 Basic net income (loss) per share $0.12 ($0.10) ($0.27) ($0.11) ($0.07) $0.04 Adjusted net income (loss) $7.3 ($2.4) ($6.8) ($0.2) $0.0 $0.02 Basic adjusted net income (loss) per share $0.19 ($0.06) ($0.17) ($0.01) $0.00 $0.01 Adjusted EBITDA $14.7 $5.4 $1.4 $8.8 $9.4 6.8% Notes: For further information, refer to reconciliation of GAAP and non-GAAP results in appendix.
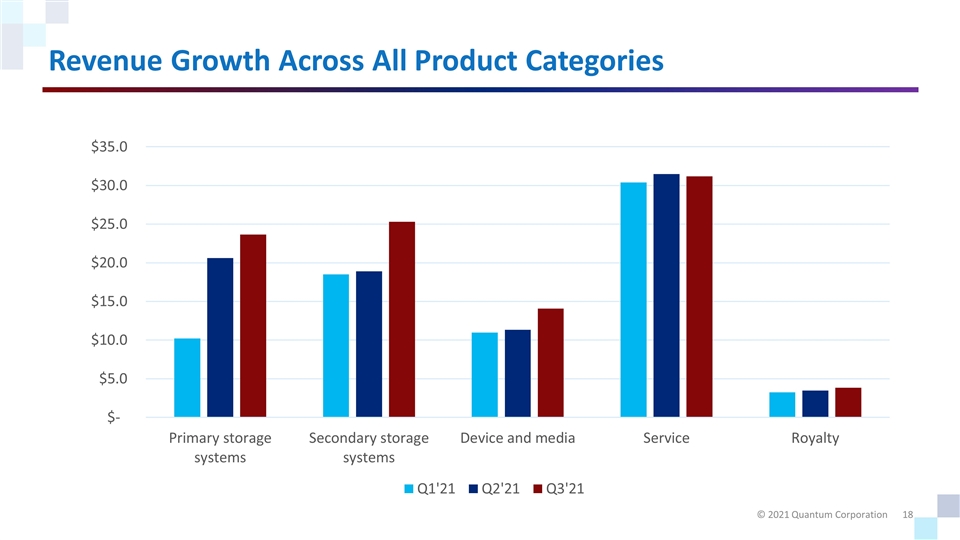
Revenue Growth Across All Product Categories
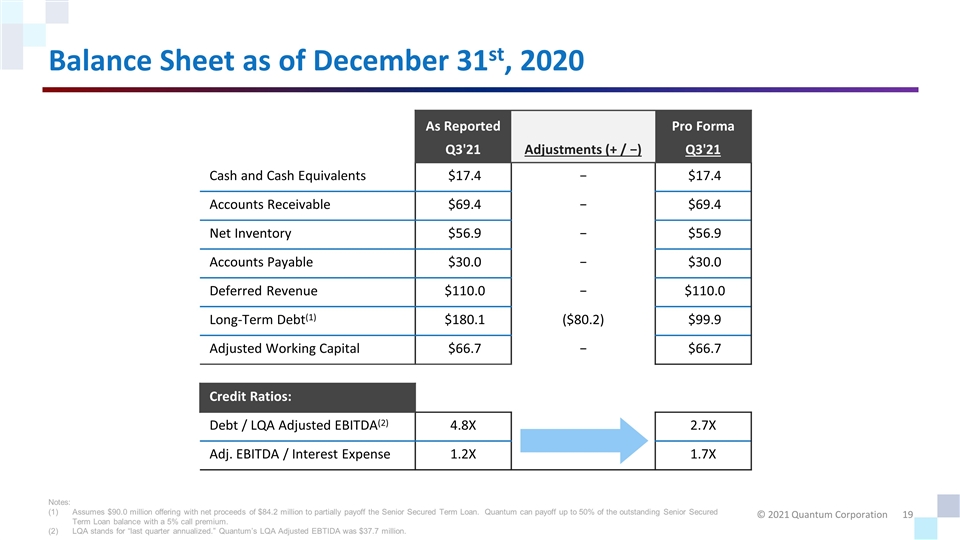
Balance Sheet as of December 31st, 2020 As Reported Pro Forma Q3'21 Adjustments (+ / −) Q3'21 Cash and Cash Equivalents $17.4 − $17.4 Accounts Receivable $69.4 − $69.4 Net Inventory $56.9 − $56.9 Accounts Payable $30.0 − $30.0 Deferred Revenue $110.0 − $110.0 Long-Term Debt(1) $180.1 ($80.2) $99.9 Adjusted Working Capital $66.7 − $66.7 Credit Ratios: Debt / LQA Adjusted EBITDA(2) 4.8X 2.7X Adj. EBITDA / Interest Expense 1.2X 1.7X Notes: Assumes $90.0 million offering with net proceeds of $84.2 million to partially payoff the Senior Secured Term Loan. Quantum can payoff up to 50% of the outstanding Senior Secured Term Loan balance with a 5% call premium. LQA stands for “last quarter annualized.” Quantum’s LQA Adjusted EBTIDA was $37.7 million.
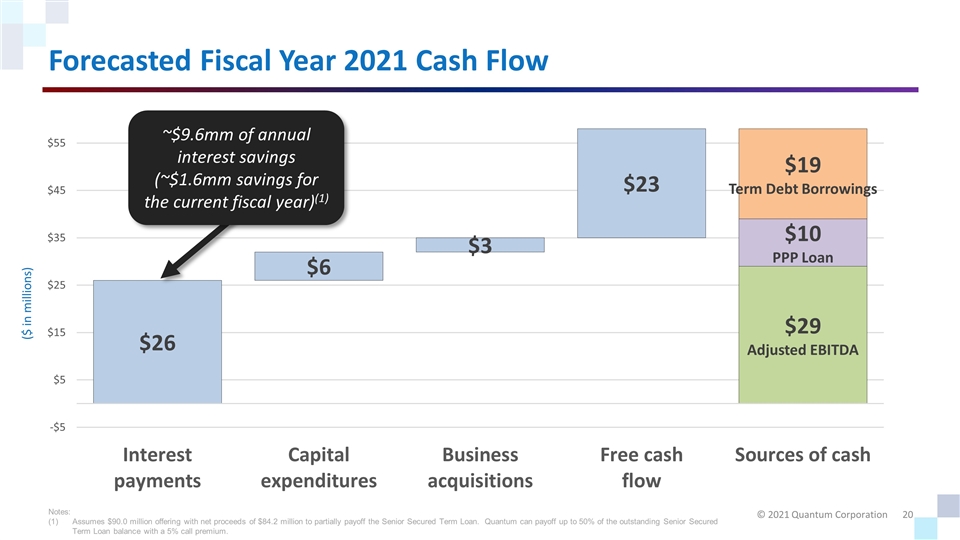
Forecasted Fiscal Year 2021 Cash Flow ($ in millions) ~$9.6mm of annual interest savings (~$1.6mm savings for the current fiscal year)(1) Notes: Assumes $90.0 million offering with net proceeds of $84.2 million to partially payoff the Senior Secured Term Loan. Quantum can payoff up to 50% of the outstanding Senior Secured Term Loan balance with a 5% call premium.
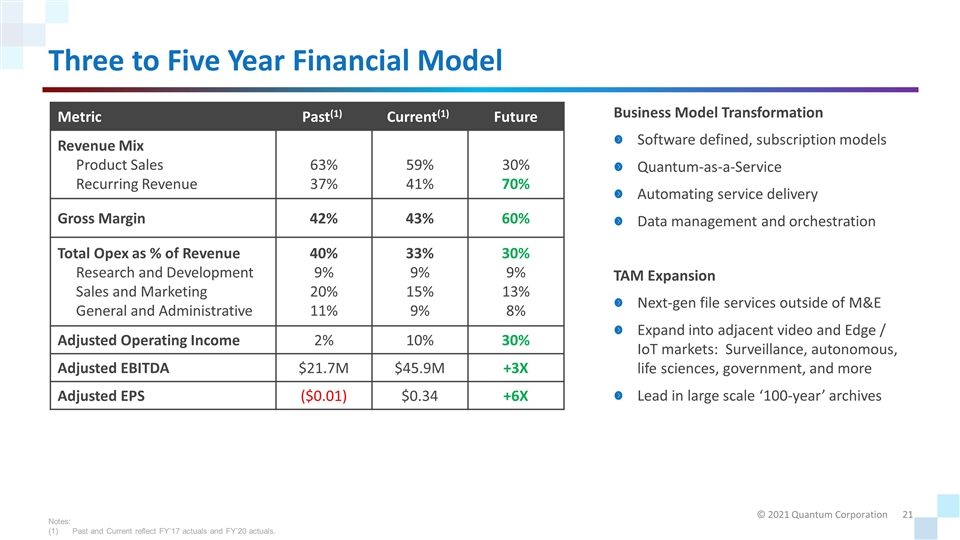
Three to Five Year Financial Model Metric Past(1) Current(1) Future Revenue Mix Product Sales Recurring Revenue 63% 37% 59% 41% 30% 70% Gross Margin 42% 43% 60% Total Opex as % of Revenue Research and Development Sales and Marketing General and Administrative 40% 9% 20% 11% 33% 9% 15% 9% 30% 9% 13% 8% Adjusted Operating Income 2% 10% 30% Adjusted EBITDA $21.7M $45.9M +3X Adjusted EPS ($0.01) $0.34 +6X Business Model Transformation Software defined, subscription models Quantum-as-a-Service Automating service delivery Data management and orchestration TAM Expansion Next-gen file services outside of M&E Expand into adjacent video and Edge / IoT markets: Surveillance, autonomous, life sciences, government, and more Lead in large scale ‘100-year’ archives Notes: Past and Current reflect FY’17 actuals and FY’20 actuals.
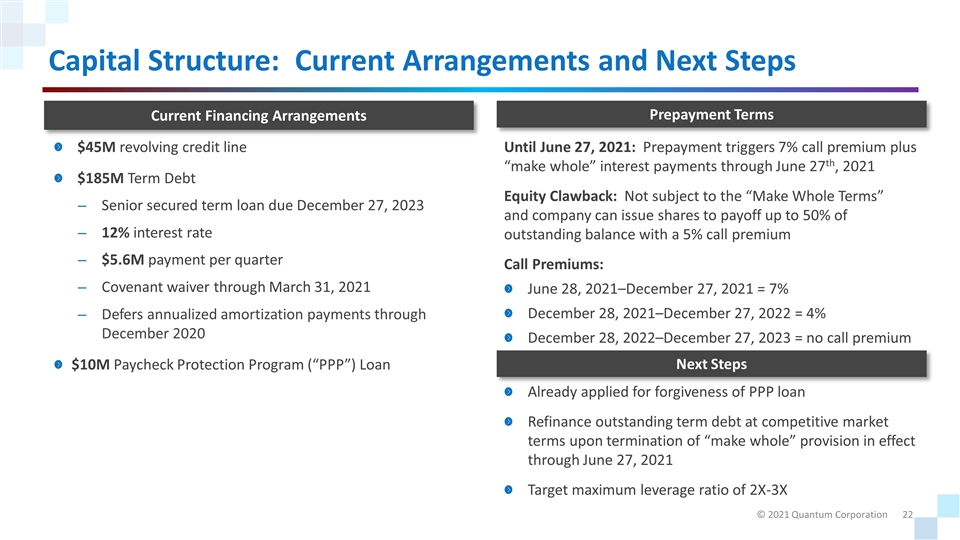
Capital Structure: Current Arrangements and Next Steps $45M revolving credit line $185M Term Debt Senior secured term loan due December 27, 2023 12% interest rate $5.6M payment per quarter Covenant waiver through March 31, 2021 Defers annualized amortization payments through December 2020 $10M Paycheck Protection Program (“PPP”) Loan Already applied for forgiveness of PPP loan Refinance outstanding term debt at competitive market terms upon termination of “make whole” provision in effect through June 27, 2021 Target maximum leverage ratio of 2X-3X Current Financing Arrangements Next Steps Until June 27, 2021: Prepayment triggers 7% call premium plus “make whole” interest payments through June 27th, 2021 Equity Clawback: Not subject to the “Make Whole Terms” and company can issue shares to payoff up to 50% of outstanding balance with a 5% call premium Call Premiums: June 28, 2021–December 27, 2021 = 7% December 28, 2021–December 27, 2022 = 4% December 28, 2022–December 27, 2023 = no call premium Prepayment Terms
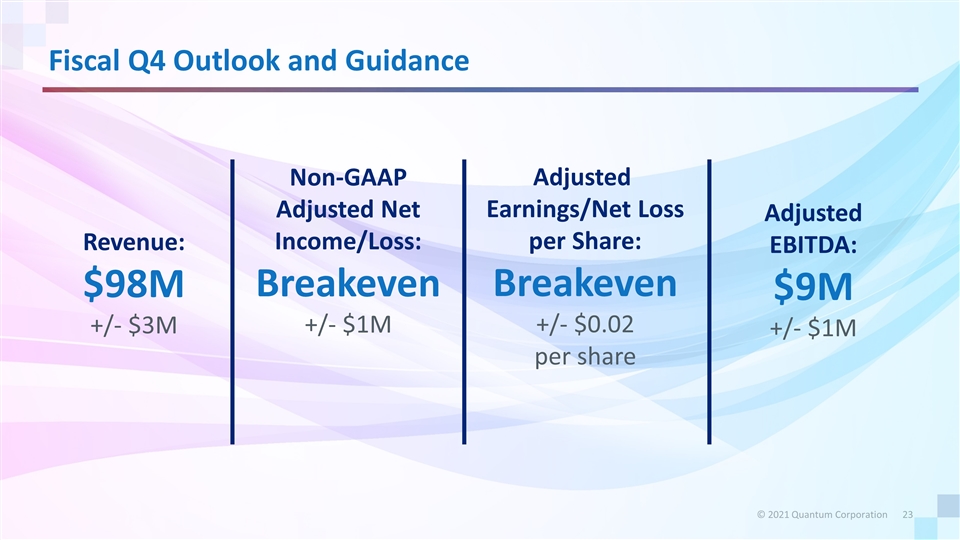
Fiscal Q4 Outlook and Guidance Revenue: $98M +/- $3M Non-GAAP Adjusted Net Income/Loss: Breakeven +/- $1M Adjusted Earnings/Net Loss per Share: Breakeven +/- $0.02 per share Adjusted EBITDA: $9M +/- $1M
NASDAQ: QMCO Appendix
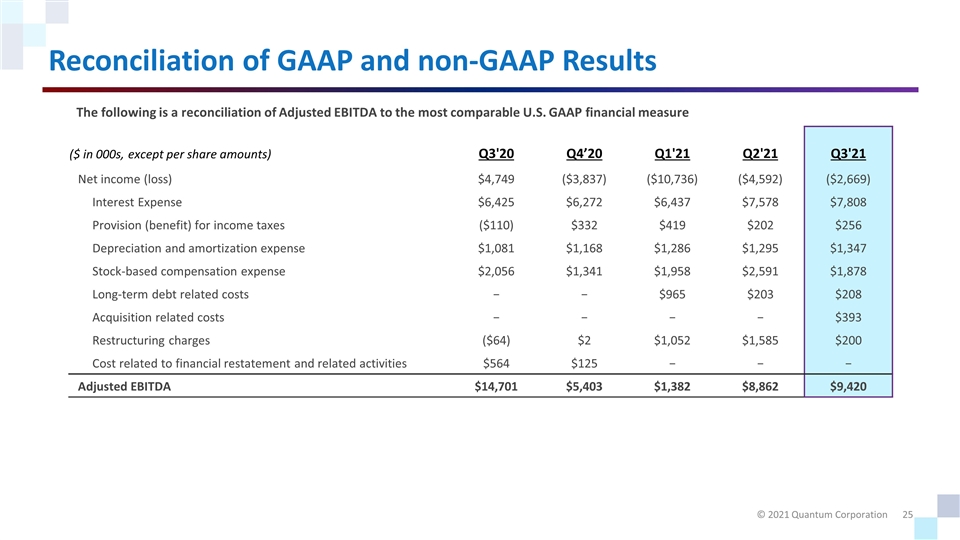
Reconciliation of GAAP and non-GAAP Results ($ in 000s, except per share amounts) Q3'20 Q4’20 Q1'21 Q2'21 Q3'21 Net income (loss) $4,749 ($3,837) ($10,736) ($4,592) ($2,669) Interest Expense $6,425 $6,272 $6,437 $7,578 $7,808 Provision (benefit) for income taxes ($110) $332 $419 $202 $256 Depreciation and amortization expense $1,081 $1,168 $1,286 $1,295 $1,347 Stock-based compensation expense $2,056 $1,341 $1,958 $2,591 $1,878 Long-term debt related costs − − $965 $203 $208 Acquisition related costs − − − − $393 Restructuring charges ($64) $2 $1,052 $1,585 $200 Cost related to financial restatement and related activities $564 $125 − − − Adjusted EBITDA $14,701 $5,403 $1,382 $8,862 $9,420 The following is a reconciliation of Adjusted EBITDA to the most comparable U.S. GAAP financial measure
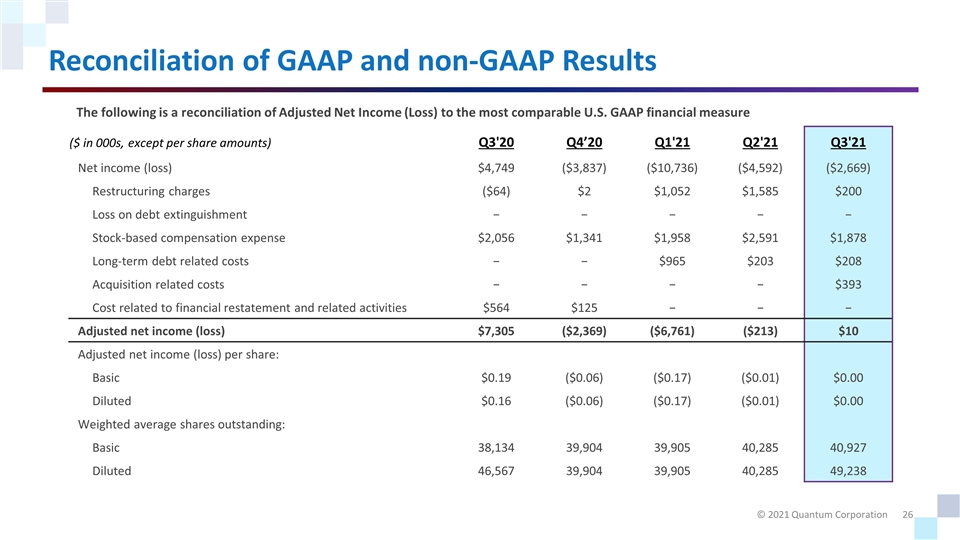
Reconciliation of GAAP and non-GAAP Results ($ in 000s, except per share amounts) Q3'20 Q4’20 Q1'21 Q2'21 Q3'21 Net income (loss) $4,749 ($3,837) ($10,736) ($4,592) ($2,669) Restructuring charges ($64) $2 $1,052 $1,585 $200 Loss on debt extinguishment − − − − − Stock-based compensation expense $2,056 $1,341 $1,958 $2,591 $1,878 Long-term debt related costs − − $965 $203 $208 Acquisition related costs − − − − $393 Cost related to financial restatement and related activities $564 $125 − − − Adjusted net income (loss) $7,305 ($2,369) ($6,761) ($213) $10 Adjusted net income (loss) per share: Basic $0.19 ($0.06) ($0.17) ($0.01) $0.00 Diluted $0.16 ($0.06) ($0.17) ($0.01) $0.00 Weighted average shares outstanding: Basic 38,134 39,904 39,905 40,285 40,927 Diluted 46,567 39,904 39,905 40,285 49,238 The following is a reconciliation of Adjusted Net Income (Loss) to the most comparable U.S. GAAP financial measure
